Building the Employee Engagement Dashboard: Real-Time Analytics for 2,000+ Employees
Here's the thing about employee engagement surveys: everyone does them, but hardly anyone does anything meaningful with the results. The district sends out a survey, collects responses, and months later produces a static PDF report that sits in someone's email inbox. By the time leadership sees the data, it's already outdated.
I wanted to change that.
How This Project Started
HCISD serves over 16,000 students across more than 30 campuses, supported by around 2,000 employees. This year, the district decided to run an employee engagement survey to understand how teachers, administrators, and staff feel about their work environment, leadership, and career growth. The problem? The traditional approach to analyzing this data was painfully slow and limited.
Shane Strubhart, our Assistant Superintendent of Community Engagement and Strategic Partnerships, approached me with a challenge: could we build something that showed engagement data in real-time? Something where leadership could watch responses come in, identify patterns immediately, and actually use the data to make decisions while it was still relevant? This is the first year HCISD is doing this kind of comprehensive engagement survey, and Shane wanted to do it right from the start.
That's when I started building the Employee Engagement Dashboard.
The Tech Stack
I went with Next.js 16 and React 19 for this project. Coming off the HCISD AI Application (which uses React + Vite), I wanted to explore what Next.js could offer for a data-heavy dashboard. The App Router's server components and built-in API routes turned out to be perfect for this use case.
The frontend runs on Next.js 16 with React 19, all written in TypeScript with strict mode enabled because I like catching bugs at compile time rather than in production. Tailwind CSS 4 handles the styling, Recharts powers all the data visualizations, and Radix UI primitives provide accessible components for things like dialogs and dropdowns.
For authentication, I'm using Azure AD through Microsoft's MSAL library. This gives us single sign-on with HCISD Microsoft accounts, which means employees don't need yet another login to remember. The token-based authentication also lets me securely access SharePoint data on behalf of the user.
The Data Layer: Working Around SharePoint
I'll be honest: SharePoint isn't what I'd choose if I were starting from scratch. But in enterprise environments, especially school districts, you work with what you have. The survey was already being collected through Microsoft Forms, which dumps responses directly into SharePoint Lists. Rather than building a separate database and creating complex sync pipelines, I decided to work with the existing infrastructure.
The challenge was getting data out efficiently. SharePoint's REST API uses OData v3 protocol, which means verbose JSON responses and pagination limits. Each request can only return 5,000 items, and with thousands of survey responses, I needed to handle pagination correctly.
To make this work reliably, I built a Power Automate flow that handles the data pipeline. This automates the process and ensures data stays synchronized without manual intervention. On the application side, Next.js API routes act as a proxy, avoiding CORS issues and keeping authentication server-side. Bearer token authentication uses tokens acquired through MSAL, and pagination handling with continuation tokens fetches all records seamlessly. The client never directly talks to SharePoint; all requests go through /api/form-responses and /api/employee-count, which handle authentication, pagination, and error handling.
Luckily for me, I used SharePoint extensively when I was a teacher, so I already knew its quirks and limitations. I'll dive deeper into that experience in a future blog post, but let's just say that familiarity made this project much more manageable than it would have been otherwise.
The Survey Structure
The engagement survey isn't just "are you happy at work?" It's comprehensive. 42 Likert-scale questions span 7 distinct dimensions: Overall Engagement with 8 core questions that serve as the primary engagement indicators, Strategic Planning with 5 questions about understanding district goals, District Leadership with 5 questions measuring trust in central administration, School/Department Leadership with 9 questions about local leadership effectiveness, Work Environment & Morale with 6 questions about day-to-day experience, Feedback & Recognition with 5 questions about feeling valued, and Career Growth & Training with 4 questions covering professional development opportunities.
Plus there are two open-ended questions: "What do you enjoy most about working at HCISD?" and "What could be improved?" This structure lets us drill down into specific areas. If overall engagement is low, we can identify whether it's a district leadership issue, a local campus issue, or something else entirely.
Statistical Methods: The Research Behind the Numbers
This is where things get interesting. Raw survey data is just numbers. Turning it into actionable insights requires statistical analysis, and the district specifically cared about one metric above all others: the Net Promoter Score.
Net Promoter Score Research
When Shane first mentioned that leadership wanted to track NPS, I had to do my homework. Net Promoter Score is typically used in customer satisfaction contexts, but adapting it for employee engagement required some research into best practices.
The eNPS (Employee Net Promoter Score) was calculated using a Likert Scale Proxy method based on the question "I am proud to work for Harlingen CISD." This approach was intentionally selected to align with the district's existing engagement framework while providing a comparable metric to industry standards. Promoters are mapped to "Strongly Agree" (5/5), Passives to "Agree" (4/5), and Detractors to "Neutral," "Disagree," and "Strongly Disagree" (1-3/5).
The sources I referenced include Qualtrics' "How to Calculate eNPS" and CultureAmp's "eNPS Methodology." Research indicates that 5-point Likert scales can be effectively adapted by treating the top box as Promoters. The NPS formula itself is straightforward: (% Promoters) - (% Detractors). A positive score is good, and above 50 is excellent.
Key Driver Analysis with Pearson Correlation
To identify which factors most strongly influence the eNPS, I performed a Key Driver Analysis using Pearson Correlation Coefficients. This is probably the most valuable statistical method in the dashboard because it answers the question: which engagement factors actually matter most?
The analysis approach groups survey items into thematic categories like Leadership and Professional Development, calculates an average score for each category per respondent, then computes the correlation between each category's score and the NPS Proxy score. A higher correlation coefficient (closer to 1.0) indicates a stronger relationship, suggesting that improvements in that area will have a greater impact on the overall eNPS.
The Pearson correlation formula looks intimidating but it's a standard statistical method:
This helps leadership prioritize: if "Feedback & Recognition" has the highest correlation but the lowest scores, that's where to focus improvement efforts.
Likert Scale Processing
All 42 questions use a 5-point Likert scale where Strongly Agree equals 5, Agree equals 4, Neutral equals 3, Disagree equals 2, and Strongly Disagree equals 1. The survey is bilingual (English/Spanish), so I built a normalizer that handles both response formats. Whether someone answers "Strongly Agree" or "Muy de acuerdo," it maps to the same numeric value.
The Largest Remainder Method
This is a small detail, but it matters. When you convert raw counts to percentages and round them, they don't always sum to 100%. If you have 33.3%, 33.3%, and 33.3%, rounding gives you 99%. I implemented the Largest Remainder Method which floors all percentages, calculates the remainder for each, then distributes the missing percentage points to values with the largest remainders first. This ensures every pie chart and distribution display adds up to exactly 100%. It's the kind of detail most people won't notice, but it would drive me crazy if I didn't fix it.
The Architecture: How Data Flows
The complete data flow from survey submission to dashboard display starts with Microsoft Forms collecting the survey, which feeds into SharePoint Lists storing the raw responses. From there, Next.js API routes handle authentication and pagination, the SharePointClient singleton manages tokens, the useDashboardData hook processes everything, the DashboardProvider context distributes state, and finally UI components render the charts, tables, and carousel.
The authentication flow works like this: the user clicks "Sign in with Microsoft," an MSAL popup opens Azure AD login, the token gets stored in sessionStorage, that token passes to API routes for SharePoint access, and the user sees the dashboard with their authorized data.
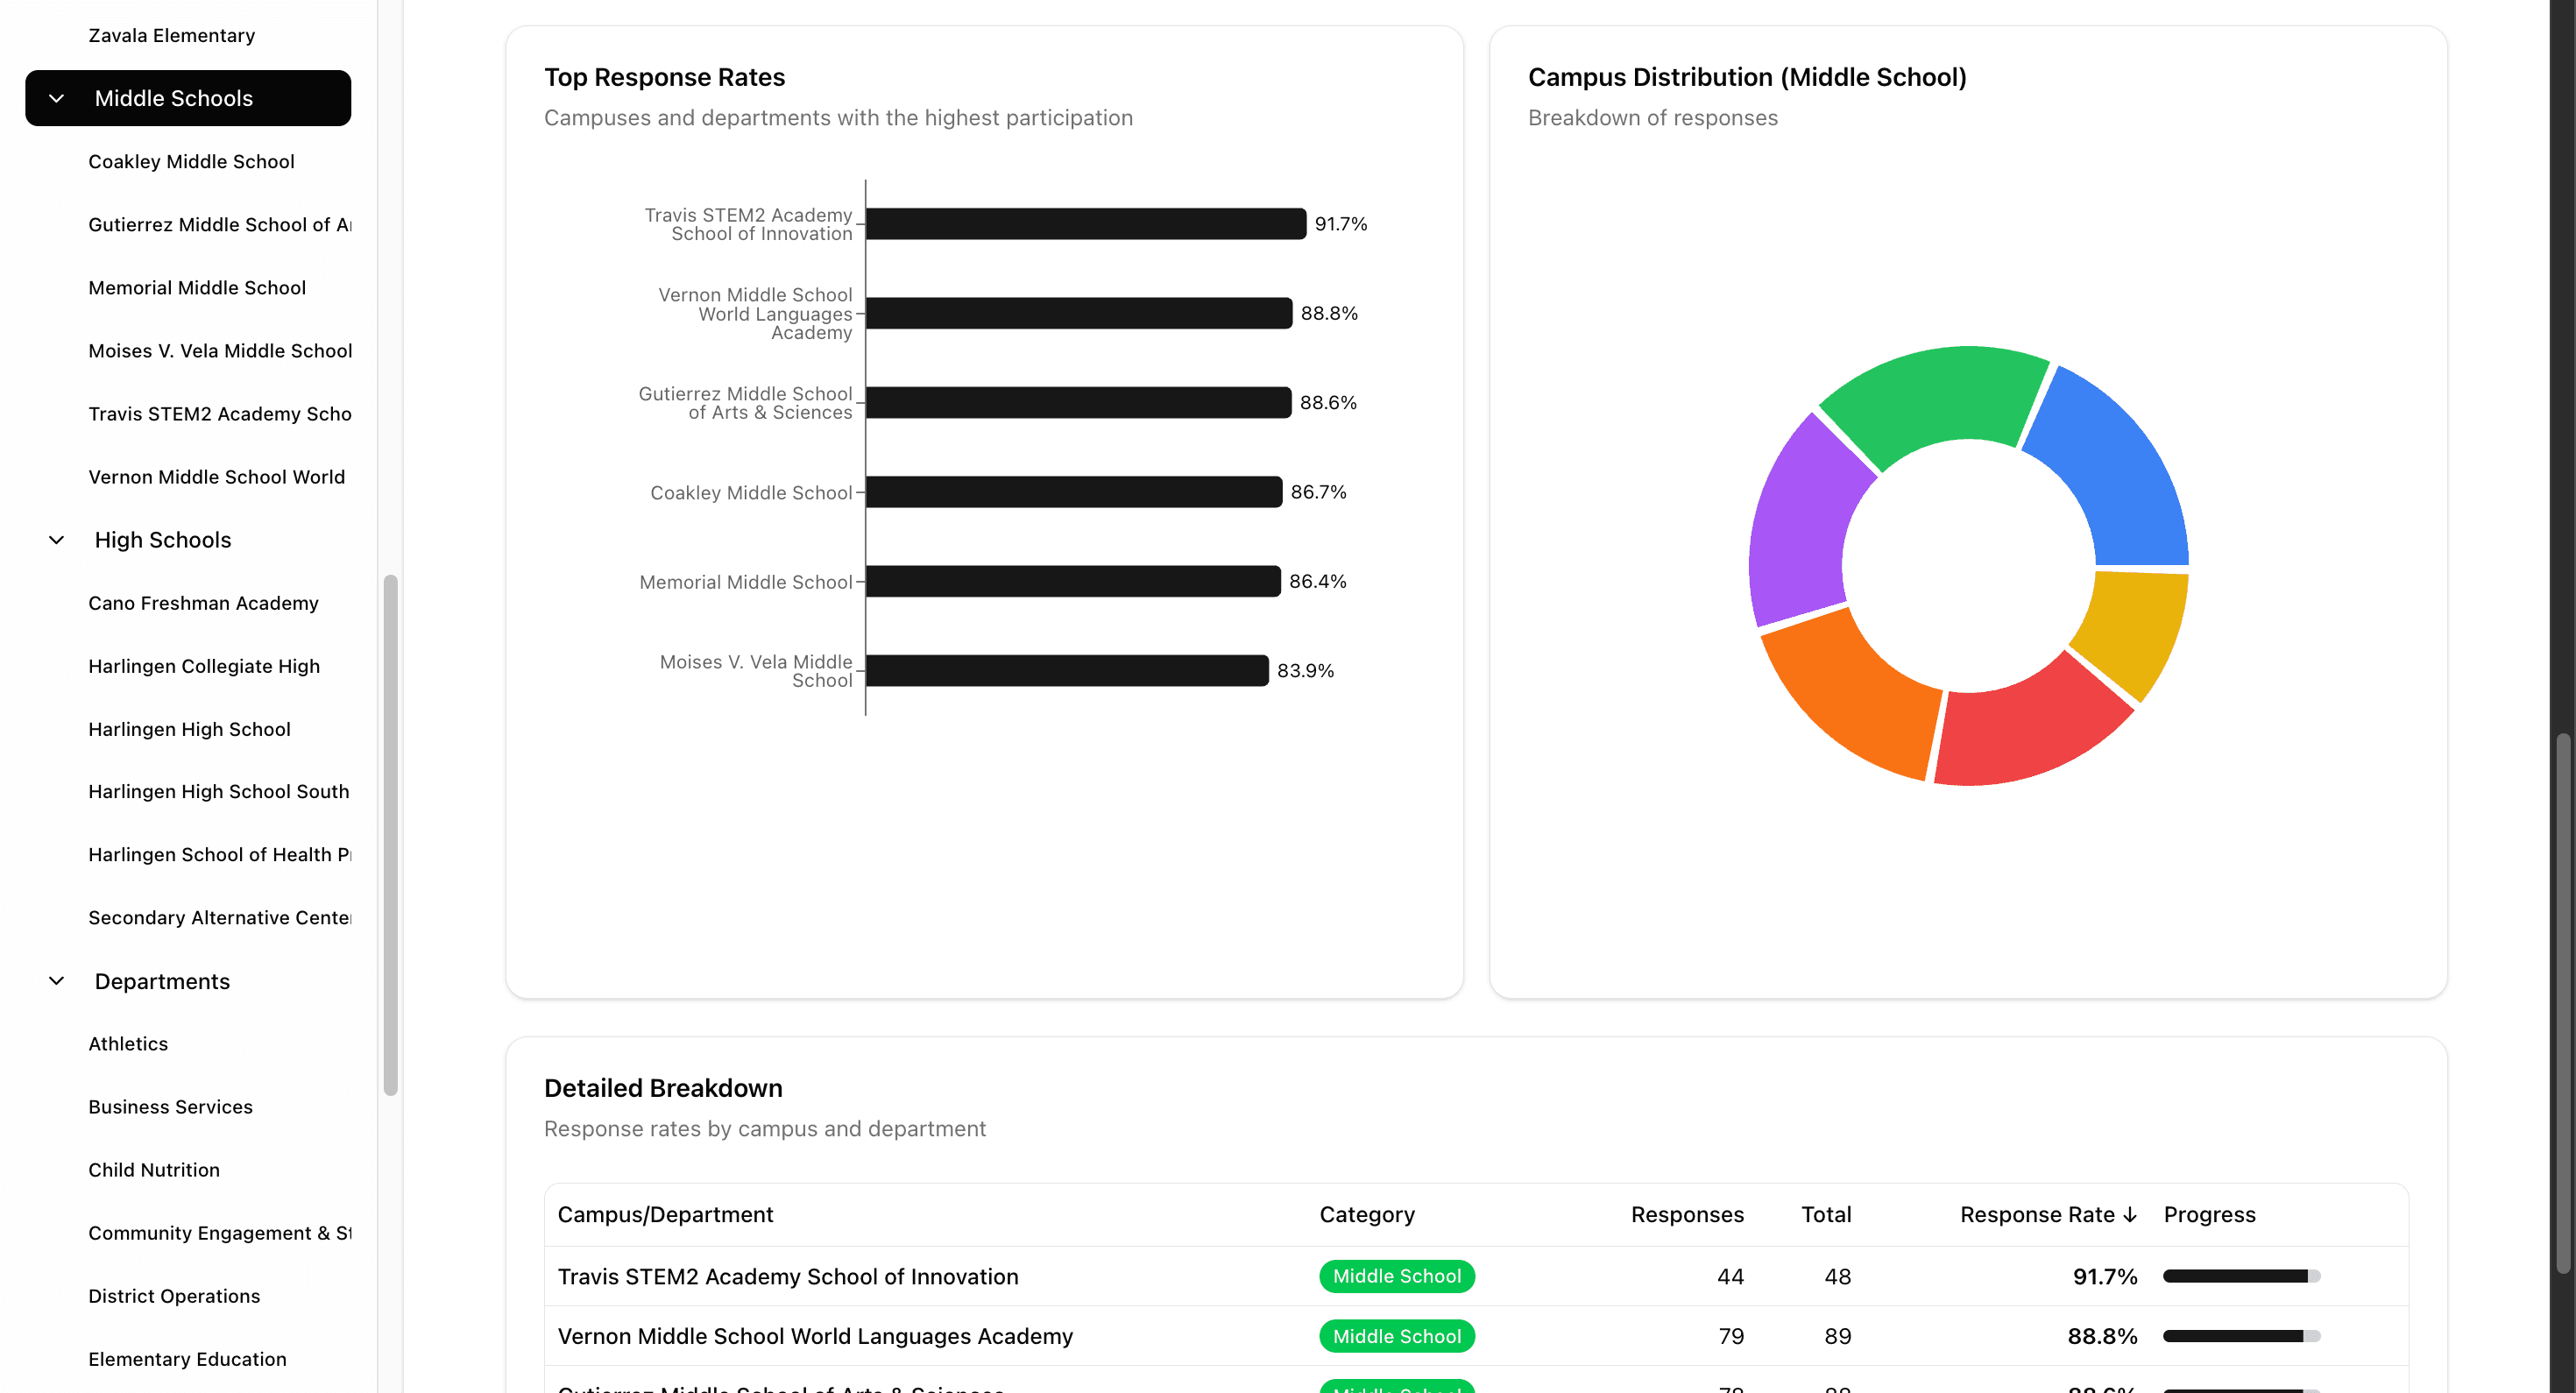
The dashboard auto-refreshes every 30 seconds. Each refresh acquires a fresh token silently without any popup, fetches both data sources in parallel, recalculates all statistics, and updates the UI with new data. This means leadership can literally watch responses come in during the survey period. When we hit 50% response rate, they know immediately. When a specific campus falls behind, it's visible in real-time.
Features I'm Most Proud Of
The Interactive Carousel
This was a beast to build but I'm really proud of how it turned out. The dashboard includes a presentation-style carousel with 28+ slides covering overall engagement breakdown, each engagement dimension in detail, focus area analysis, key driver correlations, and NPS breakdown.
Each slide is a fully interactive chart that updates based on the selected filters. You can click through the presentation and all the data responds dynamically to whatever category or campus you've selected. The challenge was performance: rendering that many complex Recharts visualizations at once would kill performance. My solution only renders slides within one position of the current slide, keeping the carousel smooth while still allowing instant navigation.
Focus Areas Matrix
One of the most actionable visualizations is the Focus Areas and Relationship to Engagement matrix. It's a 2x2 grid that plots driver rating against correlation to engagement, creating four quadrants. Yellow indicates items where improving scores will likely increase employee engagement because the average scores are low but the items have strong relationships to engagement. Green shows items where celebrating will continue to promote employee engagement since scores are already high and correlation is strong. Orange represents items where celebrating will continue to promote a positive work environment even though correlation to engagement is weaker. Blue highlights items where improving will help the workplace environment even though the correlation to overall engagement is weaker.
This matrix gives leadership a clear visual of where to focus resources for maximum impact.
Dynamic Filtering
URL-based state management means filters persist in the URL. If you filter to "Elementary Schools" and search for "Lincoln," that exact view is shareable. Send the URL to a colleague and they see the same filtered data. Filters cascade through the entire dashboard. Change the category filter and every chart, table, and statistic updates to reflect only that subset of data.
Report Generation
Leadership needed the ability to generate PDF reports for individual campuses. I built a report builder that lets you select which slides to include, filter by category and specific campuses, generate individual reports per campus, and optimize layouts for print/PDF export. The principal of Lincoln Elementary can get a custom report with just their campus data, comparing it to district averages.
What's Next: AI Integration
Here's where I'm excited about the future. Right now, the dashboard shows data. But it doesn't interpret it. That's still a human job.
My plan is to integrate AI-powered insights that provide automatic summary generation with AI-generated executive summaries highlighting key findings, trends, and anomalies. I want to add sentiment analysis using NLP to analyze the open-ended responses and surface themes from "What could be improved?" across the district. Predictive analytics could identify early warning signs of declining engagement before it becomes a problem. Natural language queries would let leadership ask questions in plain English like "Which elementary schools have the lowest engagement in career growth?" And anomaly detection could automatically flag unusual patterns when one campus suddenly has dramatically different responses than expected.
The infrastructure is ready. The data is clean and structured. Adding AI is the next logical step.
What's Next: Leaderboard System
One feature that keeps coming up in conversations with leadership is the idea of a leaderboard. Not to shame low performers, but to recognize and celebrate high performers.
I'm planning to build a Response Rate Leaderboard showing which campuses have the highest survey participation, an Engagement Score Leaderboard for top campuses by average engagement score, a Most Improved section highlighting campuses showing the greatest positive change, and an NPS Champions board for highest promoter percentages. The gamification aspect could drive healthy competition. When principals see their school at #3 in response rate, they might push a bit harder to hit #1.
Lessons Learned
SharePoint is painful but workable. I spent more time fighting OData pagination and verbose JSON than I'd like to admit. But sometimes the best solution isn't the most elegant one; it's the one that ships. My prior experience using SharePoint as a teacher definitely helped me navigate its quirks faster than I would have otherwise.
Statistical rigor matters. It would have been easy to just show raw percentages. Taking the time to research NPS methodology, implement proper correlation analysis, and handle percentage rounding correctly made the data trustworthy. Leadership can confidently make decisions based on these numbers because they know the math is solid.
Real-time changes everything. The difference between a static annual report and a live dashboard is transformational. Leadership engages differently with data they can watch evolve. There's an energy around checking the dashboard during the survey period that a PDF report could never create.
Context is key. Numbers without context are meaningless. Every chart includes comparisons: campus vs. district, this dimension vs. others. Context turns data into insight.
The Bigger Picture
This dashboard is part of a larger vision I have for HCISD: using technology to make better decisions. The AI Application helps administrators find information. The Engagement Dashboard helps leadership understand their people. Together, they represent a shift toward data-driven, AI-augmented decision making in education.
We're not replacing human judgment. We're giving humans better tools to exercise that judgment. When a superintendent can see exactly which schools are struggling with "Feedback & Recognition" and drill down to specific response patterns, they can have more targeted, more effective conversations with those principals.
That's the goal. Not dashboards for the sake of dashboards. Better outcomes for employees, which ultimately means better outcomes for students.
Connect
Working on something similar in your organization? Have questions about building SharePoint integrations, statistical analysis in React, or data visualization?
- Work Email: andres.gonzales@hcisd.org
- Personal Email: andrisgonzalis@gmail.com
- GitHub: @andres-ai-dev
I'm always happy to talk data, dashboards, and education technology.