Adding AI and Leaderboards to the Employee Engagement Dashboard
Hey everyone! This serves as part 2 of the employee engagement dashboard I've built for HCISD. I've added 2 major features that really help with the open-ended responses nobody had time to read, and the competitive spirit that could drive better participation. So I built an AI assistant and a leaderboard system.
The Problem with Open-Ended Responses
Who has time to read through hundreds or thousands of text responses? I don't haha! Before this update, administrators would have to manually scroll through each response, trying to identify patterns and themes. It was tedious, time-consuming, and honestly, it just wasn't happening.
The engagement survey has two open-ended questions: "What is one thing you enjoy most about working for HCISD?" and "What is one thing the district could do to improve?" These responses are gold for understanding employee sentiment, but only if someone actually analyzes them.
Enter the AI Assistant
I already had the infrastructure from my HCISD AI Application, the one using Firebase, Vertex AI, and a RAG pipeline. So I thought, why build something new when I can extend what already works? I took that foundation and integrated it directly into the engagement dashboard.
The AI assistant runs on Gemini under the hood. I actually built in a model selector that lets users toggle between two modes: a faster mode using Gemini 2.5 Flash Lite for quick responses, and a smarter mode using the full Gemini 2.5 Flash for more comprehensive analysis (Still super duper fast). The toggle is right there in the chat interface, green for faster, blue for smarter.
Context-Aware Queries
The real power isn't just having an AI that can chat. It's having an AI that understands context. I built a context selector that lets administrators scope their questions at three levels.
At the district level, the AI analyzes all employee engagement data across HCISD. You can ask things like "What are the main themes in employee feedback?" and it processes responses from every campus and department. At the category level, you can focus on just Elementary schools, Middle schools, High schools, or Departments. Maybe you want to know what middle school teachers specifically enjoy about their work. And at the individual campus/dept level, you can drill down to individual schools/dept. For example, what are Lincoln Elementary employees saying about professional development?
This scoping system means the AI isn't just giving generic answers. It's analyzing the specific subset of data you care about.
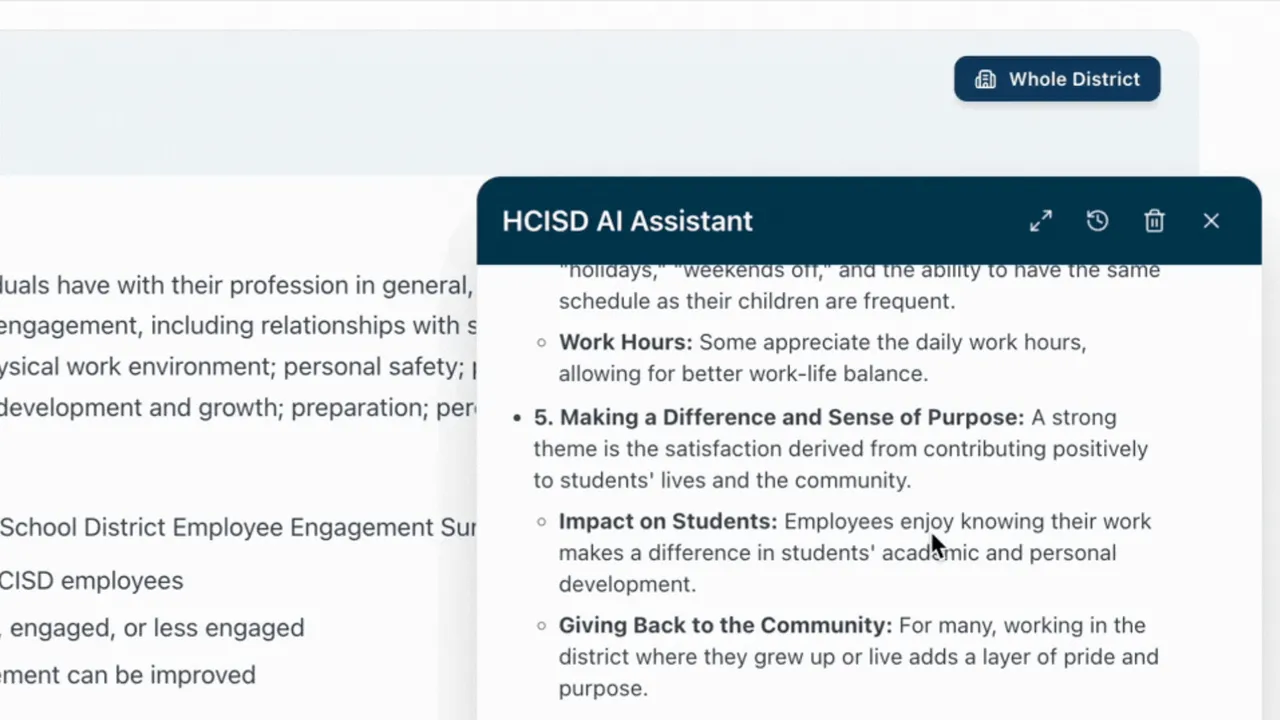
Analyzing Open-Ended Responses
This is the feature I'm most excited about. The AI can now synthesize themes from all those open-ended text responses that nobody had time to read.
I built an OpenEndedSelector component that lets you choose which questions to include in your query. You can ask the AI to analyze just the positive feedback (Q1), just the improvement suggestions (Q2), or both. Then you ask something like "What do employees enjoy most about working at HCISD?" and the AI processes all those text responses, identifies patterns, and gives you a coherent summary.
Before, an administrator would spend hours trying to manually categorize feedback. Now they get synthesized insights in seconds. They can ask follow-up questions, dig deeper into specific themes, and actually use the qualitative data.
How It Works Under the Hood
The AI doesn't just get a simple prompt. I built a comprehensive data preprocessor that packages up everything the AI needs to give informed answers. When you send a query, it includes all 42 survey questions with their full distribution data (not just top and bottom performers), all campus locations sorted by response rate, category breakdowns with response statistics, engagement level distribution across Highly Engaged, Engaged, and Less Engaged, Net Promoter Score analysis with Promoters, Passives, and Detractors, and the open-ended responses filtered by whatever scope you've selected. The preprocessor is about 550 lines of code dedicated to formatting survey data into AI-digestible context. It's the same calculations the dashboard uses, so the AI's answers are consistent with what you see in the charts. For the chat experience, I implemented streaming responses using Server-Sent Events. You see the AI's response appear token by token in real-time, just like LLM Providers. Users can stop generation if the response is going in a direction they don't need. All conversations are stored in Firebase, so administrators can come back to previous analyses.
The Leaderboard System
The second major feature is leaderboards. Leadership had been asking about ways to recognize high-performing campuses and create some healthy competition around survey participation. The leaderboard ranks campuses across 11 different metrics: Overall Engagement, Strategic Direction, District Leadership, School/Department Leadership, Communications, Work Environment, Feedback & Recognition, Professional Development, Net Promoter Score, and Response Rate.
The Podium Display
I built a visual podium for the top 3 performers in each metric. Gold, silver, bronze styling with a trophy icon for first place. Below that, you get a Top 10 table and a Bottom 10 table. You can filter by category to see just Elementary schools competing against each other, or view all campuses across the district. There's also an exclusion filter. Sometimes you want to remove certain campuses from the rankings, maybe they're outliers or have special circumstances. The filter lets you multi-select campuses to exclude from the current view.
Reports Feature
I also enhanced the reports system. The big addition is bulk export. You can select multiple campuses and generate individual PDF reports for each one. The system creates a ZIP file with organized folders: one for aggregate reports (District, All Elementary, All Middle School, etc.) and separate folders for each category's individual campus reports.
What's Next: Role-Based Access
The feature I'm building now is role-based access control. The vision is to give principals access to only their campus data, while district administrators see everything. The infrastructure is already there. Azure AD handles authentication with HCISD Microsoft accounts. Firebase Authentication manages the AI chat feature. The context scoping system in the AI already supports campus-level filtering. I just need to wire up the role detection so the system automatically scopes data based on who's logged in. A principal logs in, they see their school's engagement data, their leaderboard position, and can ask the AI questions about their specific campus. They can't see other schools' detailed data. District admin logs in, they see everything.
The Bigger Picture
This started as a dashboard showing survey response rates. Now it's becoming another HCISD AI platform that makes the data accessible in ways that just weren't practical before. This really does enforce data driven decisions and That's the goal with everything I'm building at HCISD. Whether that's policy documents in the AI Application or survey responses here, the pattern is the same: information is only valuable if people can actually access and understand it.
What I've learned So Far
When building this application and many others, one thing I'm learning is consistency. Both AI Applications have to look and feel the same, the end user experience is extremely important to me. Which is why I made it a goal to have the same look and feel as the HCISD AI application I already built.
Connect
Questions about integrating AI into analytics dashboards? Want to talk about building leaderboard systems or processing survey data at scale?
- Work Email: andres.gonzales@hcisd.org
- Personal Email: andrisgonzalis@gmail.com
- GitHub: @andres-ai-dev
Always happy to chat about AI, education technology, and making data useful.